Analyse of yield base on diameter
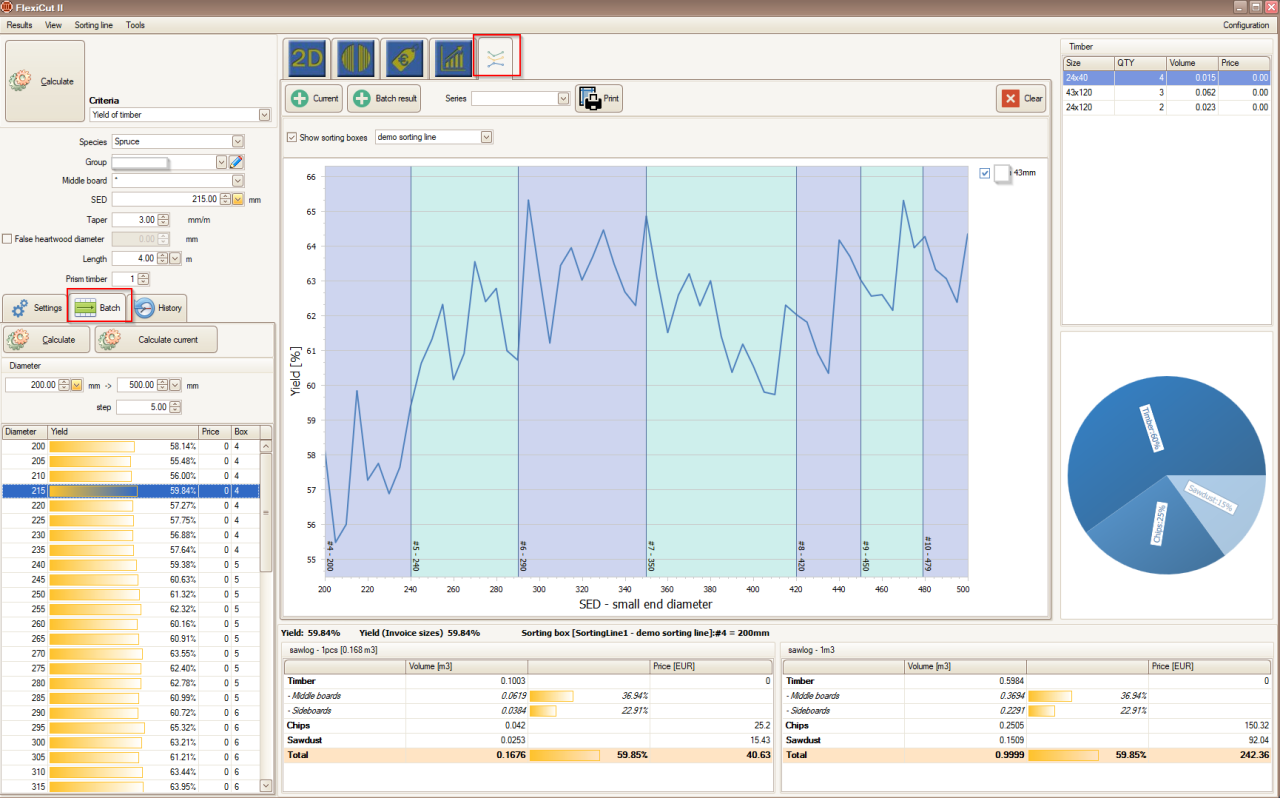
With CutLog you can easily analyse particular production set and it's yeld from different sawlog diameters. In FlexiCut is used Batch calculation for this purpose:
For batch calculation you have to define starting and ending diameter and incremental step. After calculation you will see list of diameters on the left side (on image is 60 diameters and calculation of those diameters takes only 8 seconds...! )
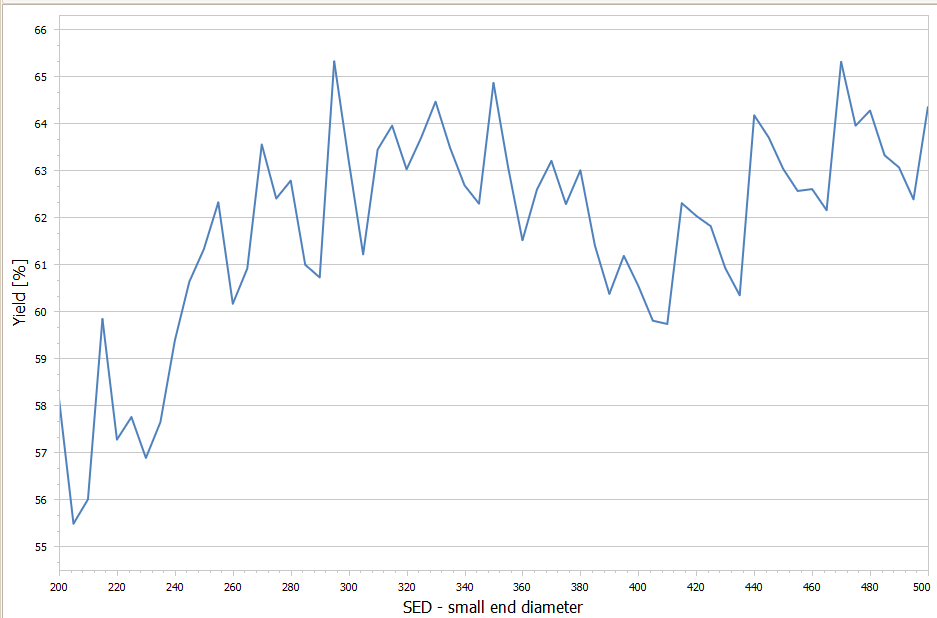
Then into Magic chart you can import results and you will see graph with diameter on X axis and yield of Yaxis:
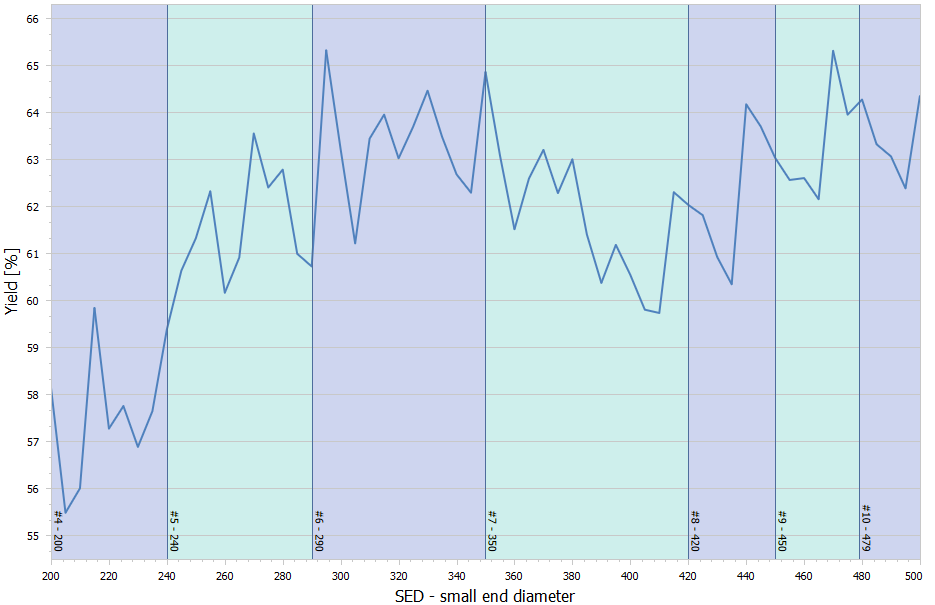
And in case you have Sorting lines optional module you can enable sorting boxes and you can see sawlog sorting boxes and where is the best or the worst yield:
It is great help for analyse, which diameters are the best for taking sawlogs for your required products!
There is no faster way to do it! It takes a few minutes to get results and you can do it anytime.
for dive into Magic chart see article below

MagicChart in depth - Blog

Free download of timber sawing optimization software
Enter your text here ...

Price of timber sawing optimization software
Enter your text here ...
By accepting you will be accessing a service provided by a third-party external to https://www.cutlog.com/


